Using the Queries Page
The Queries page displays queries that have run on your deployed models, including those run by users accessing models from BI tools, and those run by the system (for example, when building aggregates).
To access the Queries page, click Queries in the left-side navigation of Design Center.
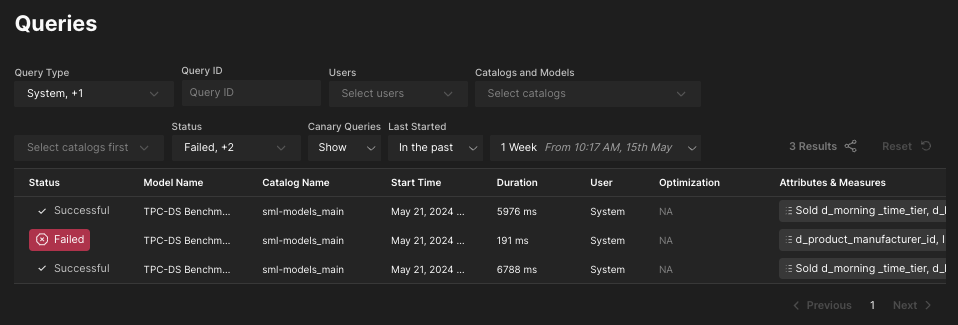
The Queries page displays all queries that have run recently on the catalogs and models you have permission to view. It also displays high-level details about each query, including:
- Its status (Successful, Failed, and so on).
- The name of the model and catalog it ran on.
- Its start time and duration.
- The user who initiated the query.
- Any optimizations defined for the query.
- The specific model attributes and metrics the query ran on.
You can filter the queries displayed in the table using the fields above it. For example, you can filter by queries run in a specific timeframe, or run by a particular user.
View query details
You can click on a query in the table to open the query details panel, which displays additional information about it.
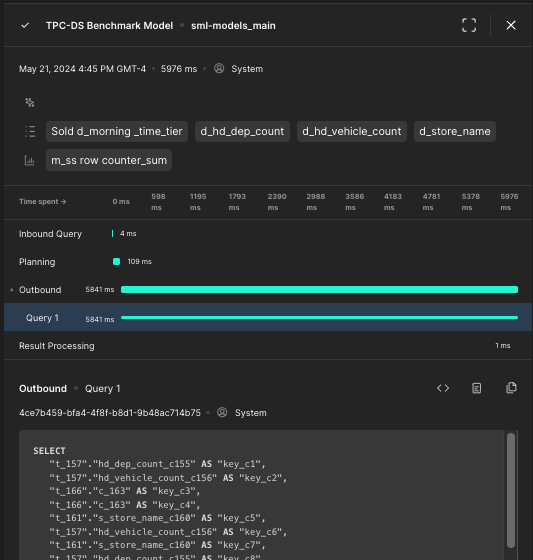
The panel shows a full breakdown of the specific optimizations configured for the query, as well as the attributes and metrics it ran on. It also displays a detailed timeline of the query run.
View aggregate details
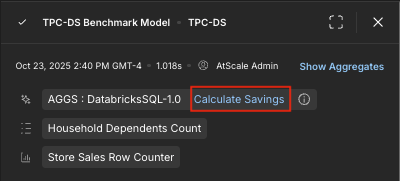
For inbound queries that hit aggregates, the query details panel contains a Show Aggregates link:
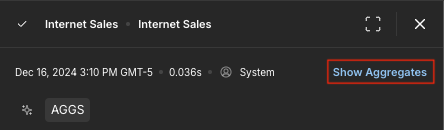
You can click the link to open the Aggregates panel at the bottom of the page, which displays details about the aggregate definitions and instances used by the query, much like the Aggregates page.
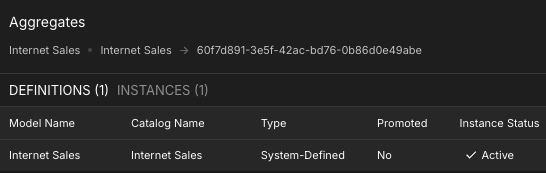
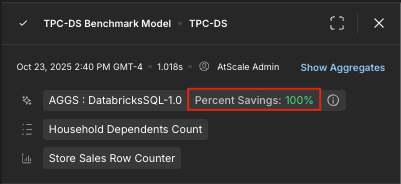
You can also click Calculate Savings to view the effectiveness of each aggregate, expressed as a percentage.
This functionality is not supported for PostgreSQL or InterSystems IRIS data warehouses.
The aggregate's effectiveness is calculated as the sum of the costs of the query's subqueries if they had been processed without the aggregate, divided by the sum of the costs of the query's subqueries having been processed with the aggregate.
An aggregate's cost savings vary depending on your data warehouse platform. Additionally, the savings calculated by AtScale do not account for the cost of creating the aggregate.
View query phase details
You can also click on the inbound and outbound phases in the timeline to view the full SQL for that phase. For outbound queries, you can toggle between the SQL and Aggregate Analysis tabs:
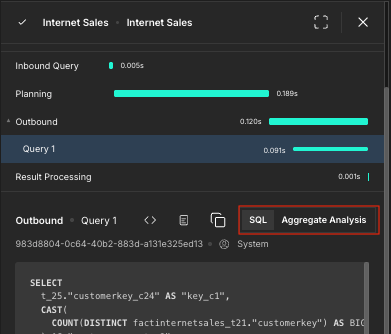
- The SQL tab displays the full SQL for that phase. You can also click the Show query plan icon to view the phase's full query plan.
- The Aggregate Analysis tab displays the candidate aggregates approved for the query, as well as generation and rejection reports. This information can help you determine why your query did or did not result in an aggregate.
You can enable/disable aggregate analysis reports using the aggregates.prediction.reports.storePredictorData global setting. For more information, see Aggregate Settings.
Cancel a query
You can cancel a running query by hovering over it in the list and clicking the Cancel button that appears.
Configure the query display
The Queries page may become unresponsive when large queries are returned. To prevent this, you can use the following global settings to limit the number of characters displayed for inbound and outbound queries:
query.characterLimit.displayInbound(100,000 by default)query.characterLimit.displayOutbound(50,000 by default)
If a query exceeds one of these limits, a truncated version of the query appears in the details panel. The full query can be displayed in a separate tab if needed.